Intro (experiment 1)
We wanted to see how net force and mass affected the acceleration of a system. The independent variable was the net force of the system and the dependent variable was the acceleration of the cart. Our controls were the surface the cart ran on, the path of the cart, the string, the pulley system, the cart itself, and the total mass of the system.
Procedure
1. Set up the logger pro motion sensor
2. Find the mass of the total system
3. Measure the force of the mass on the hanger with a force sensor
4. Release the hanger and let the cart run while the motion sensor collects data
5. Find acceleration on logger pro
2. Find the mass of the total system
3. Measure the force of the mass on the hanger with a force sensor
4. Release the hanger and let the cart run while the motion sensor collects data
5. Find acceleration on logger pro
Materials, Diagram, & Video


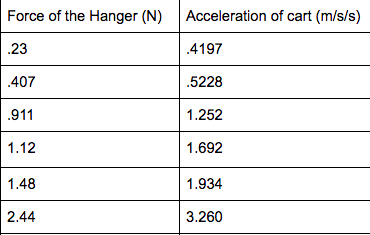
Data
Acceleration vs. Net Force Graph
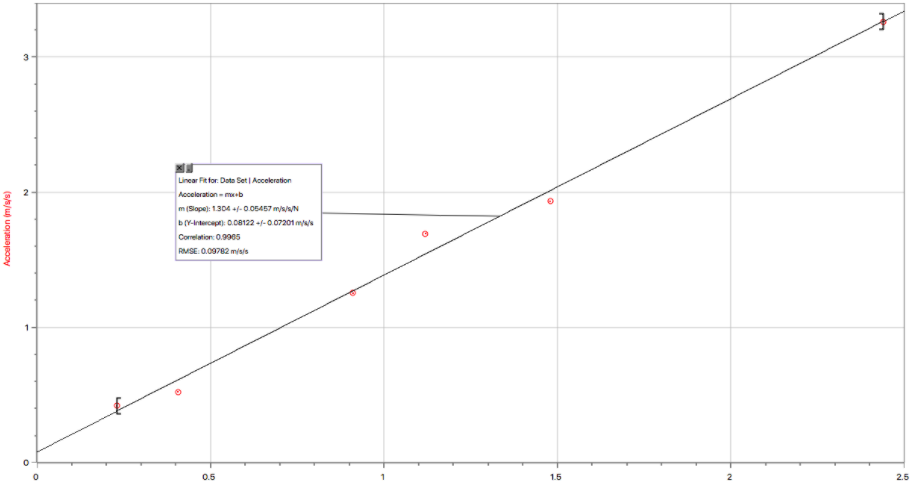
This graphs is linear which means the slope is constant. Since the slope is constant then for every one newton increased the acceleration will increase constantly by the same amount. They y - intercept according to Newton's Second Law should be zero but with error ours is 0.8122 m/s/s.
Equation - Acceleration (m/s/s) = 1.304 (m/s^2/N) x Net Force (Newtons) + 0.8122 (m/s/s)
Equation - Acceleration (m/s/s) = 1.304 (m/s^2/N) x Net Force (Newtons) + 0.8122 (m/s/s)
Intro (experiment 2)
We wanted to figure out what the affect of the mass of a system has on the acceleration of the system. The independent variable is the total mass of the system and the dependent variable is the acceleration of the system. The constants are the surface, the cart, the pulley, the string, the weight on the hang, and the net force of the system.
Procedure
1. Set up the logger pro motion sensor.
2. Measure and change the mass of the system.
3. Let the cart run while logger pro records the velocity vs. time
4. Use logger pro and the velocity vs. time to make an acceleration vs. mass graph
2. Measure and change the mass of the system.
3. Let the cart run while logger pro records the velocity vs. time
4. Use logger pro and the velocity vs. time to make an acceleration vs. mass graph
Video
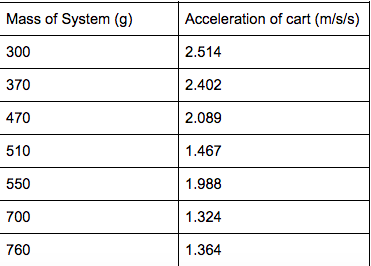
Data
Acceleration vs. Mass graph
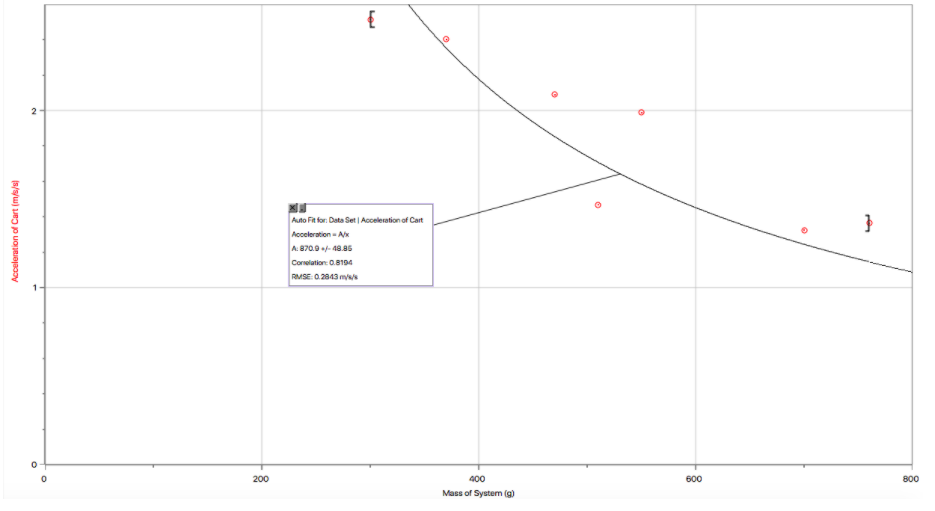
The line in this is not linear which means the slope is not constant. The acceleration starts to decrease by less and less as the mass increases. The y-intercept is non existent. This also backs up Newtons Second Law.
Equation - Acceleration (m/s/s) = 870.9 (m/s^2/kg) / mass (kg)
Equation - Acceleration (m/s/s) = 870.9 (m/s^2/kg) / mass (kg)
Conclusion and Evaluating Procedures
I have decently high confidence in the experiment. We had a good range and good number of trials but there was some error. The data could have been skewed when we forgot to stop the motion sensor and the motion sensor or the biggest skewing of the data is when we took the velocity time graphs and tried to transform them to acceleration vs. mass and net force graphed. Overall the experiment taught us a lot about Newton's Second Law. It showed us how the mass and net force effect the acceleration of a system. If the net force stays the same and the mass increases then the acceleration decreases. If the mass stays the same and the net force increases so does the acceleration.
