Position - Where an object is located
Displacement - How far away the object is located in retrospect to a reference point.
Distance - The total distance traveled from the initial point to the final point.
Displacement - How far away the object is located in retrospect to a reference point.
Distance - The total distance traveled from the initial point to the final point.
Position vs. Time Graph #1
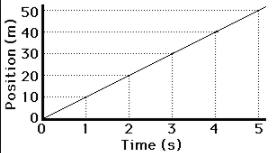
This is one example of a position vs time graph of Jerrico the Raccoon. You can see the graph is linear so guess that this means. Yes, the raccoon has a constant velocity. It is moving away from the initial position which is at zero.
Position vs. Time Graph #2
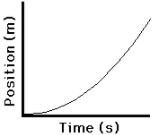
This is another example of a position time graph with Jerrico the raccoon. Look, Jerrico found some cheese he wants to eat off in the distance. He starts at an initial position of zero but then his velocity is increasing and he is accelerating because he is very excited to get the cheese. This graph is not linear so that is the first signal to you that is is not linear.
Velocity vs. Time Graph
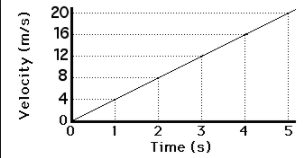
Here is the velocity vs. time graph for Jerrico the Raccoon. Do not get this confused with a position vs. time graph he is not moving at a constant velocity, that would look like a straight line. This is Jerrico accelerating or his velocity increasing at a constant rate. This is the velocity vs. time graph for when he run after the cheese. The initial velocity here is zero because it says so on the graph when time is zero the velocity is too. Acceleration the the change in velocity and it can be speeding up or slowing down.
Equation for Average Velocity
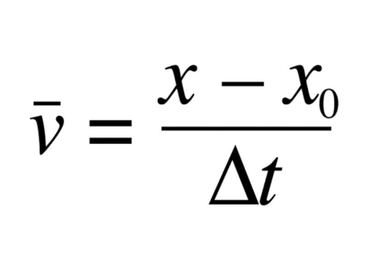
How to find the average velocity for a certain interval is the final position minus the initial position divided by the final time minus the initial time. This is basically the slope of the graph if it is a position vs. time graph over that interval.
Finding the Distance
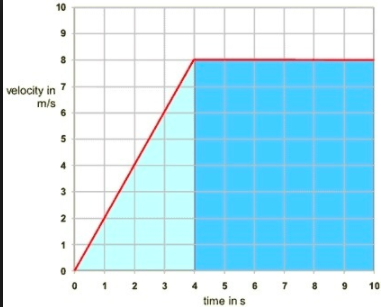
To find the distance traveled you take the area from under the velocity vs. time graph.
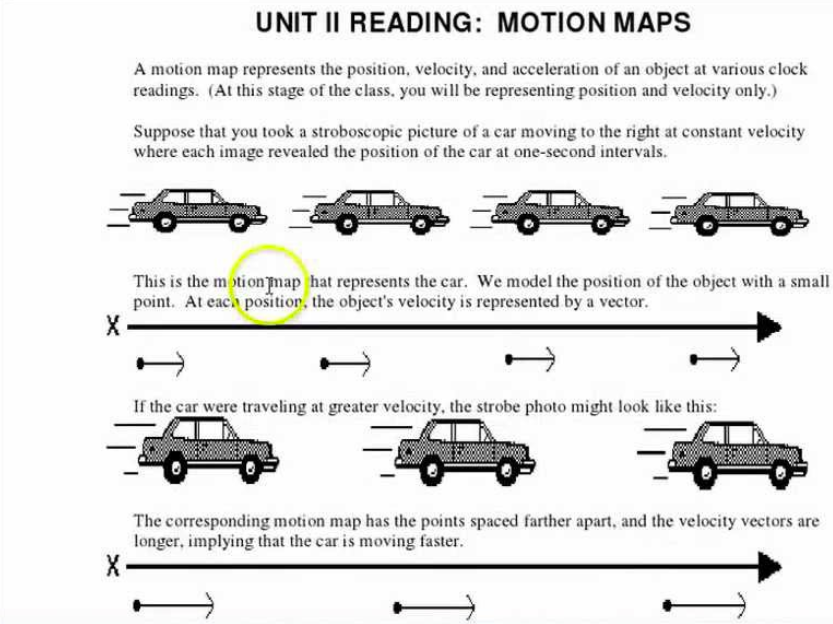
Motion Map