Introduction
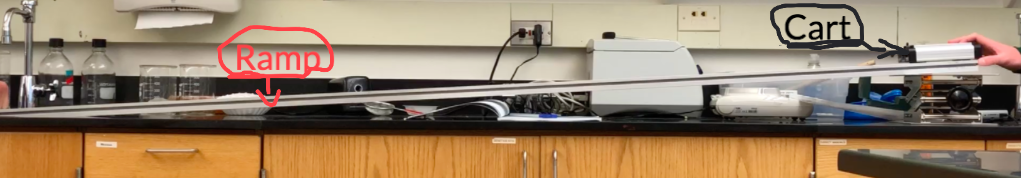
In this lab we were trying to figure the distance a cart roles in a certain amount of time. The real thing behind this was getting a better understanding of acceleration. The cart is on a slanted ramp so it has acceleration. The independent variable is the time the cart rolls and the dependent variable is the position of the cart. With the cart and the surface (ramp) it runs, the tools used to measure the data points (phone, video, and logger pro).
Procedures
1. Set up cart on the ramp
2. Get a meter stick to use for reference point
3. Set up camera to take a video of the cart. Make sure the camera does not move and gets the whole ramp in it.
4. Let the cart run down the ramp while capturing the video.
5. Look over video to make sure it can be used for video analysis
6. Collect the video and upload into logger pro
7. Use video analysis to get data points and a graph for the cart running down the ramp.
What We Used

The cart we used for the lab

We used the iPhone X to take a video of the experiment
The Data
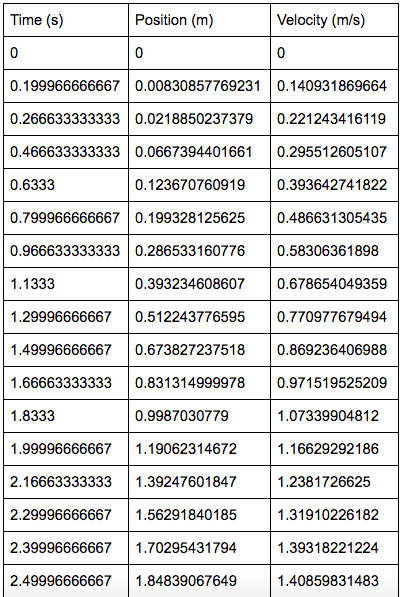
As you can see in the data here is that the position keeps increasing by more and more. If you wanted to do it the easier way you could just look at the velocity section to find that out. The velocity is increasing which proves there is acceleration. If you goto the graphs below it supports the data table showing there is acceleration and how the carts velocity is almost increasing at a constant rate.
Position vs. Time Graph
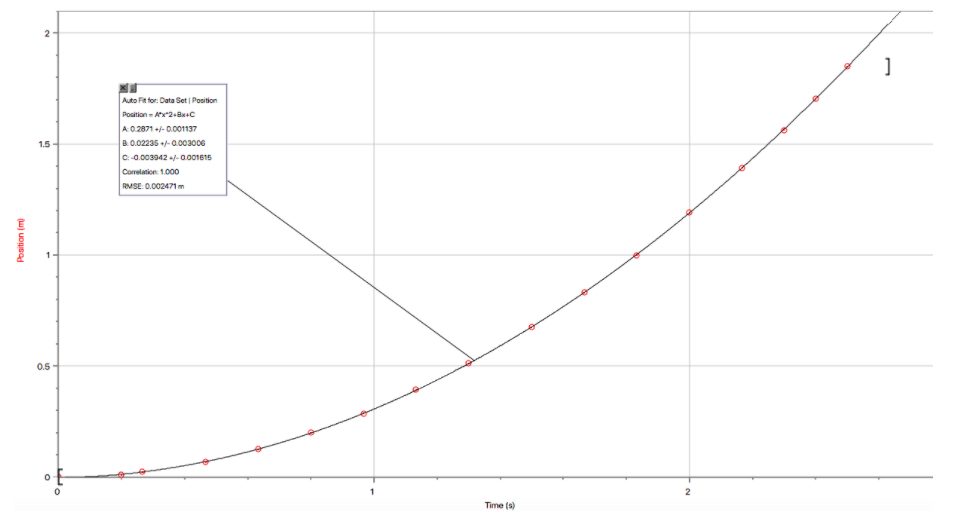
What does this graph mean? This graph is non-linear so we know the buggy does not have a constant velocity. The slope of the graph is increasing which means that the velocity is also increasing. The y-intercept is -0.003942 meters which means that is how far away the buggy starts from the set origin in the video analysis.
Equation - Position (meters) = 0.2871 (m/s) x time (seconds)^2 + 0.02235 (m/s) x time (seconds) - 0.003942
Equation - Position (meters) = 0.2871 (m/s) x time (seconds)^2 + 0.02235 (m/s) x time (seconds) - 0.003942
Velocity vs. Time Graph
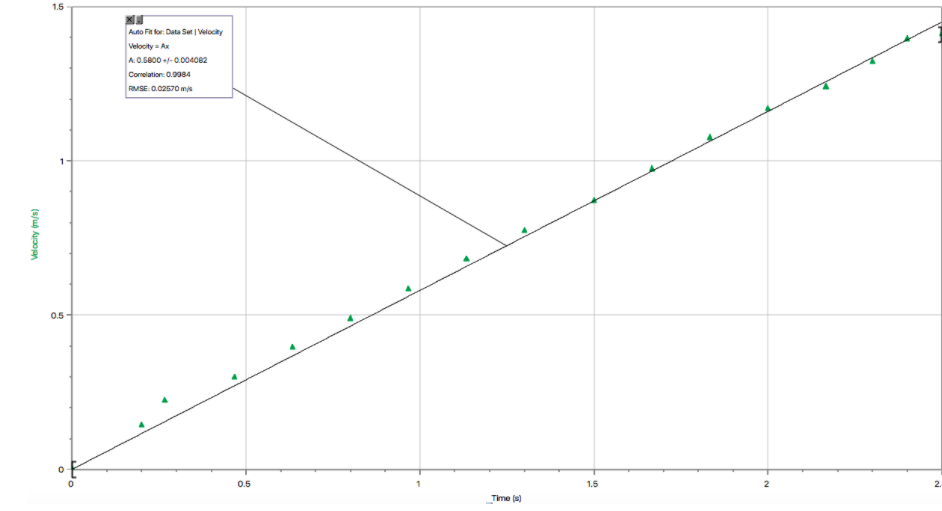
What does this graph mean? This graph is leaning which means it has a constant increase in velocity. This is not a position time graph so the slope of this is not the velocity but it is the acceleration. The acceleration is constant because the line has constant slope. The slope is 0.580 m/s/s. The y - intercept is zero or non existent because when the time is zero the velocity is zero. So basically the initial velocity is zero m/s.
Equation - Velocity (m/s) = 0.580 (m/s/s) x time (s)
Equation - Velocity (m/s) = 0.580 (m/s/s) x time (s)
Evaluating Procedures & Conclusion
What we figured out is that the cart has a constant acceleration. This is because of the slanted ramp which causes the velocity to increase. If the position vs. time graph was linear then it would be constant velocity and no acceleration. The velocity vs. time graph is linear though which gives a constant acceleration so the acceleration is a straight line. We got to have a better look into how do do video analysis and use and interoperate the graphs. I have medium to high confidence in our data. Our procedures were good by setting up the camera far enough away to capture the entire video without moving the camera. We also had good controls with the buggy and the cart staying the same. The only things causing uncertainty and not giving me high confidence in the experiment is that we only did one trial. I wish we could have done three or more but with time restrictions we only had time for one. We also are still getting used to using logger pro video analysis so some error could have been made there leading to uncertainty. Overall I am pleased with the results and how it showed us acceleration and how to get the velocity from at position vs. time graph and also how to see the acceleration form a velocity vs. time graph. To conclude the experiment it is 100% certain that the cart has an increasing velocity because it has a non zero constant acceleration.
