In this experiment we were figuring out how far a toy buggy ran in a certain amount of time. We also used 3 different ways to figure out the collected data for the lab. We took the data with a stop watch, with a motion sensor, and using logger pro's video analysis. Our independent variable was the amount of time the buggy ran for and the dependent variable was the change in position of the buggy. Our controls were the meter stick we used for measurement, the surface the buggy ran on and the buggy itself.
Procedures
Stop Watch Motion Sensor Video Analysis
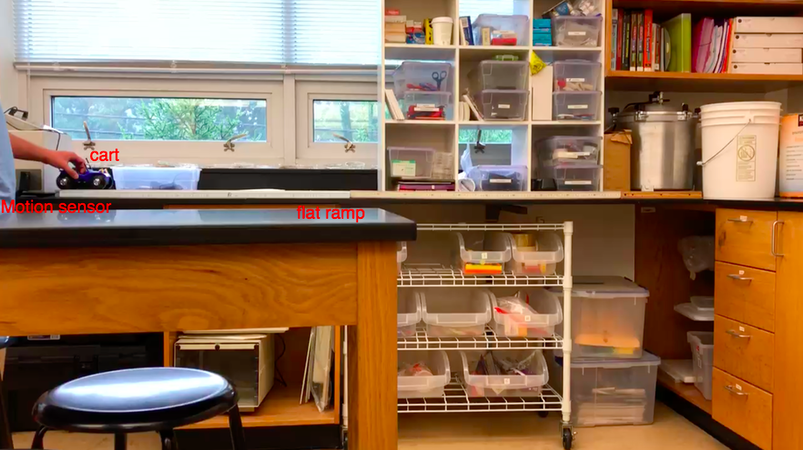
1. Set up the buggy at 0 cm 1. Set up the motion sensor to track 1. Position a camera to collect a video of
on the track. the amount of distance the buggy covered. the buggy running (the camera can't move)
2. Turn on the buggy and release 2. Start the motion sensor and the buggy 2. Record and save the video then plug it
it to run on the track. at the same time. plug it into logger pro to get a graph and a
data table.
3. Start the stopwatch when the 3. Let the buggy run to the end of the track
buggy is released and stop the and let the motion sensor collect the data.
buggy when the amount of time
you're using to measure elapses.
4. Run 3 trials for each data point.
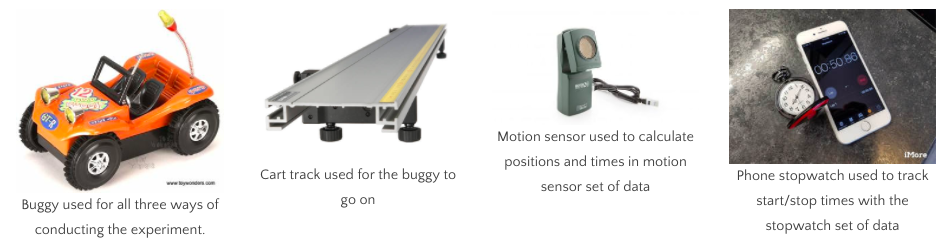
What We Used
| Buggy Video |
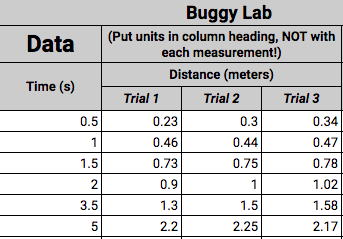
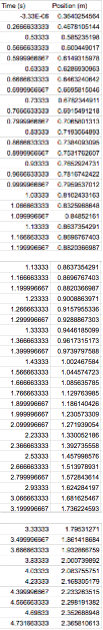
Stop Watch Raw Data
Motion Sensor Raw Data
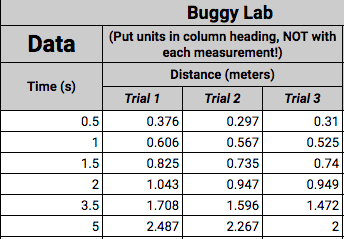
Video Analysis Raw Data
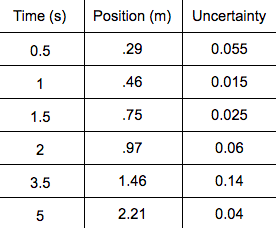
Stopwatch Processed Data
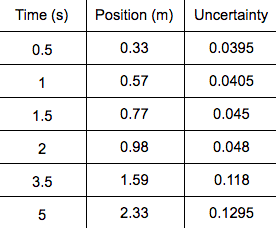
Motion Sensor Processed Data
Stopwatch Graph
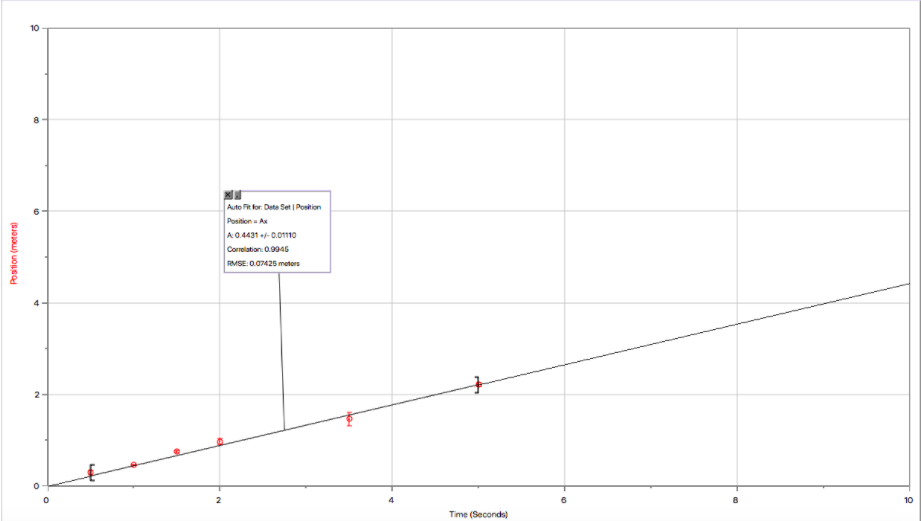
What does this graph mean? This graph is showing that because it is linear the buggy has a constant velocity. The slope of the graph is 0.4431 meters/second. That means for every 1 second the buggy moves 0.4431 meters. The y-intercept is zero because after zero seconds the buggy has not moved.
The equation - Position (m) = time (s) x 0.4431 (m/s)
The equation - Position (m) = time (s) x 0.4431 (m/s)
Motion Sensor Graph
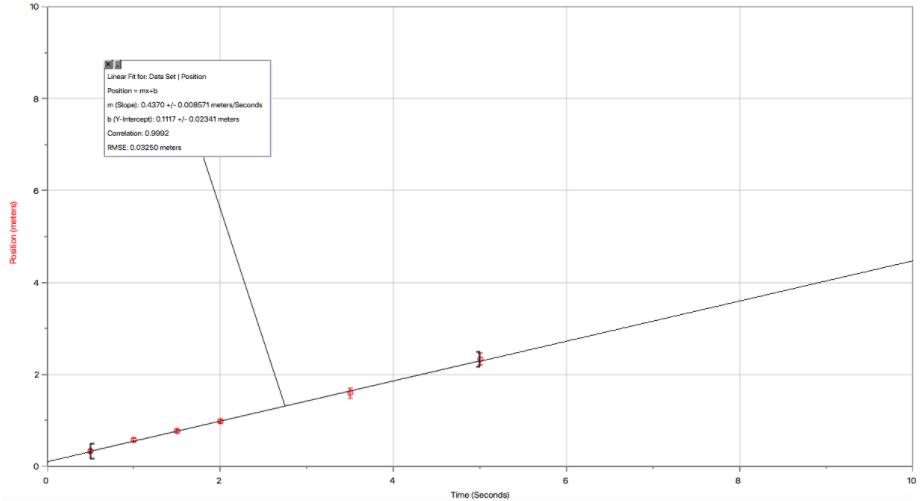
What does this graph tell us? It is linear so it has a constant velocity like the stop watch. That is expected because the buggy is a control variable. The slope of the graph is 0.4370 meters/second. That means it moves 0.4370 meters every 1 second. The y-intercept is 0.1117 and that is because the buggy starts 0.1117 meters away from the motion sensor.
The equation of the graph - position (m) = time (s) x 0.4370 (m/s) + 0.1117
The equation of the graph - position (m) = time (s) x 0.4370 (m/s) + 0.1117
Video Analysis
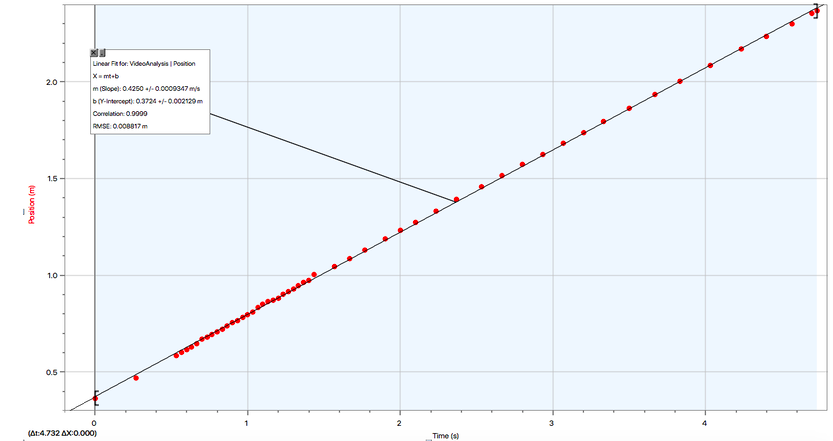
This graph is also linear like the 2 others because the buggy is still moving at a constant velocity. The slope of the graph is 0.4250. That means for every 1 second the buggy moves 0.4250 meters. The y-intercept is 0.3724 and that is because the buggy started 0.3724 meters away from the beginning of the track when we collected the data.
The equation - Position (m) = Time (s) x 0.4250 (m/s) + 0.3724
The equation - Position (m) = Time (s) x 0.4250 (m/s) + 0.3724
Evaluating Procedures & Conclusion
In the end all of our graphs method of collecting data turned out to have different data. They were all very similar but all the had a different slope on their graph which is their average constant velocity. One thing is for certain in all 3 graphs is the buggy had a constant velocity matching all of the linear graphs. There was uncertainty in the procedures with the stop watch and motion sensor. The stopwatch we had a different person (Timmy) releasing the buggy and a different person (myself) stopping the buggy and manning the stop watch. It is also hard to stop the buggy at the exact amount of time. The motion sensor is not always reliable because it cannot collect motion from an object moving backwards. Our lab group also misused the motion sensor by only taking a few data points from it instead of using all of the data points. I have very high confidence in our data because we ran multiple trials and have a large range of data but there is uncertainty. In the end I would say the video analysis is the best way to collect data because it had the least amount of uncertainty.
